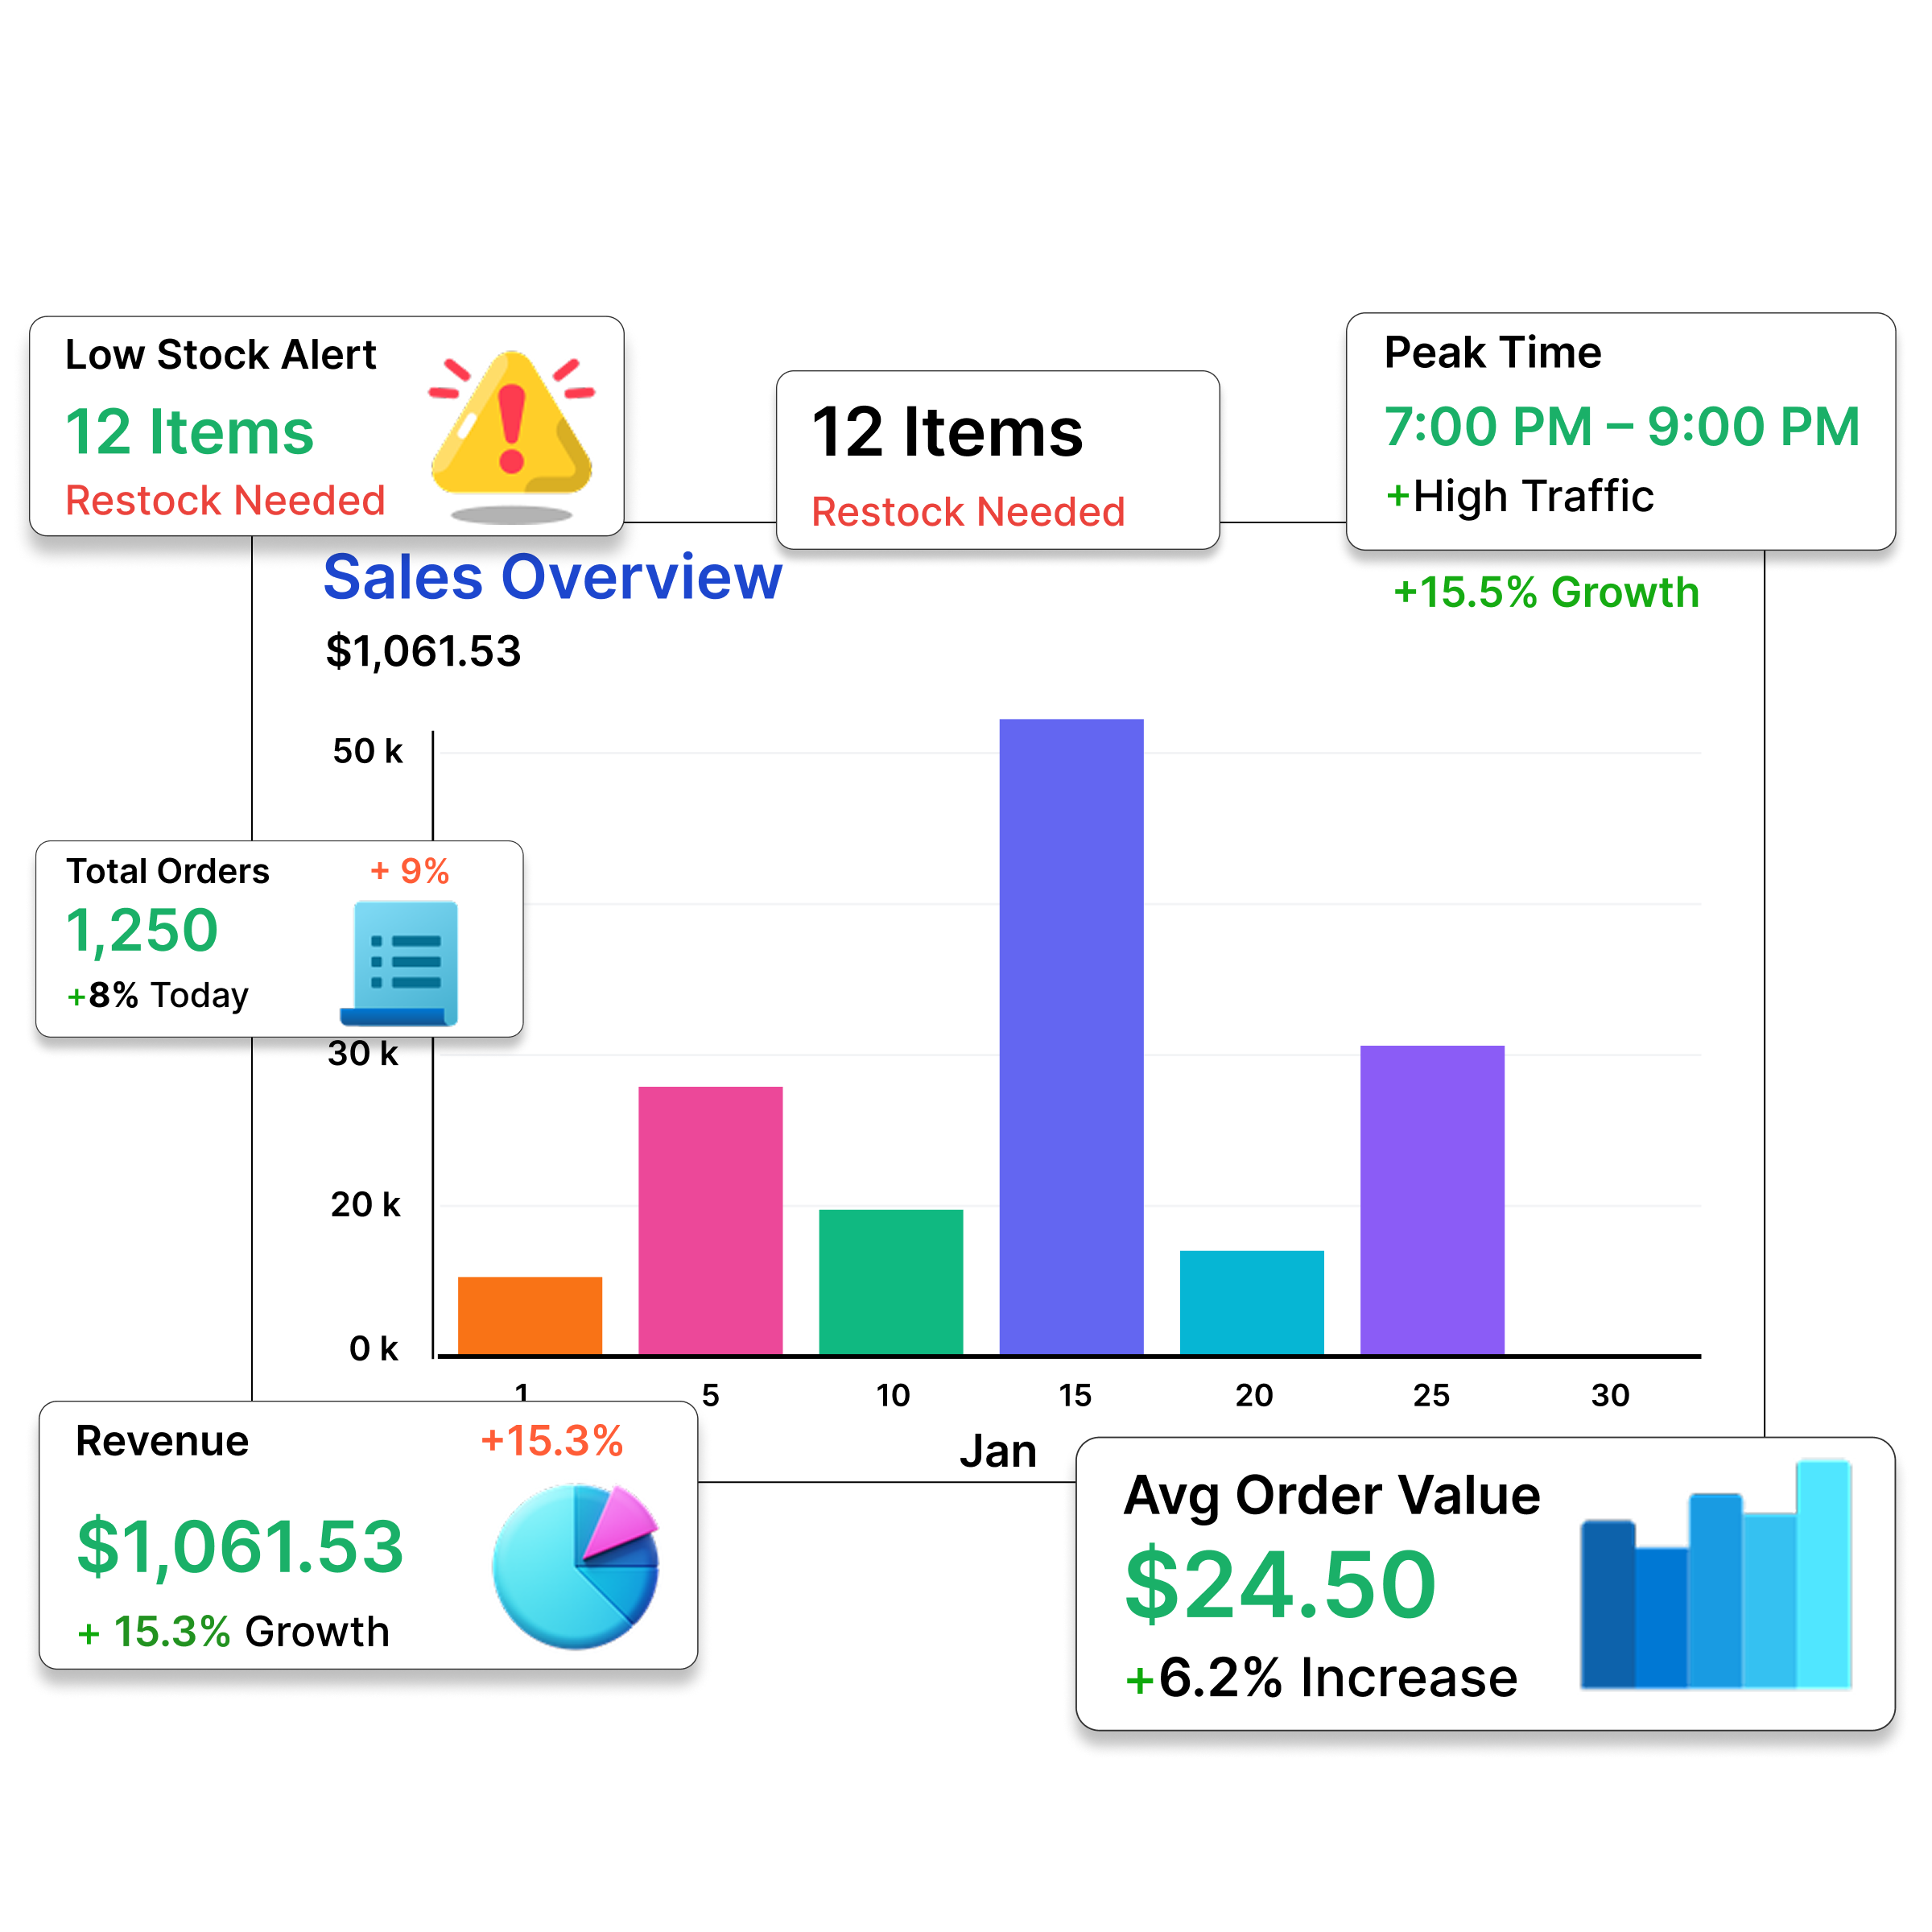
Growing from one location to multiple is the dream of every restaurant and retail owner. But with growth comes complexity — and the biggest challenge is maintaining visibility across all your locations. Without multi-location reporting, you are flying blind. With it, you have the data you need to make smart decisions that drive profitability across your entire operation.
The Multi-Location Reporting Challenge
When you run one store, you can walk the floor, check the numbers at the end of each day, and know exactly how your business is performing. With multiple locations, that is impossible. You need consolidated data that shows you everything at a glance, with the ability to drill into any individual location when something needs attention.
Operators using multi-location reporting save an average of 12 hours per week on cross-location reconciliation and reporting — time that is reinvested into strategic decisions.
What To Track Across Locations
Effective multi-location reporting focuses on the metrics that matter most for your business. Here are the key categories every multi-location operator should track.
Sales Performance
Compare sales across locations by day, week, month, and year. Which locations are outperforming? Which need attention? Track comparable store sales (comps) to understand true growth, not just new location contributions.
Labor Efficiency
Labor cost as a percentage of sales is the most important metric for multi-location operators. Compare it across locations to identify which stores are running efficiently and which need help. Track overtime trends and scheduling accuracy.
Inventory Performance
Inventory variance — the difference between what you should have sold based on sales data and what you actually used — reveals theft, waste, and process issues. Compare variance across locations to identify best practices and problem stores.
- Sales: Revenue, comps, transactions, average check
- Labor: Cost percentage, overtime, scheduling accuracy
- Inventory: Variance, shrinkage, turnover ratio
- Profitability: Gross margin, contribution margin, EBITDA per location
Building Your Reporting Dashboard
A modern POS with multi-location support gives you a dashboard that shows every location's performance in real time. The best dashboards include: a location comparison view that ranks stores by key metrics, trend lines showing performance over time, alert flags for metrics outside normal ranges, the ability to drill into any location for detail, and scheduled report delivery via email.
Setting Up Multi-Location Reports
Choose 5-8 metrics that matter most for your business
Establish target ranges for each metric based on historical data
Set up automatic alerts when metrics fall outside target ranges
Automate daily, weekly, and monthly report email delivery
Schedule a weekly review of location performance with your team
Making Decisions With Multi-Location Data
Multi-location reporting is only valuable if it drives action. Use the data to identify underperforming locations and provide targeted support, recognize and replicate best practices from top-performing stores, make informed decisions about new locations based on what works, optimize inventory allocation across locations based on demand patterns, and adjust staffing models based on location-specific traffic patterns.
Conclusion
Multi-location reporting transforms how you manage a growing business. Instead of reacting to problems after they happen, you see trends developing across all your locations and act before they become issues. The investment in the right POS platform with robust multi-location reporting pays for itself many times over in better decisions and improved profitability.